LTC Price Prediction: Will Halving and Technicals Fuel a Rally to $150?

#LTC
- Technical Breakout Potential: MACD crossover and Bollinger Band squeeze suggest impending volatility.
- Halving Aftermath: Reduced supply could fuel long-term appreciation if demand holds.
- ETF Catalyst: Regulatory clarity may trigger institutional inflows.
LTC Price Prediction
LTC Technical Analysis: Bullish Signals Emerging
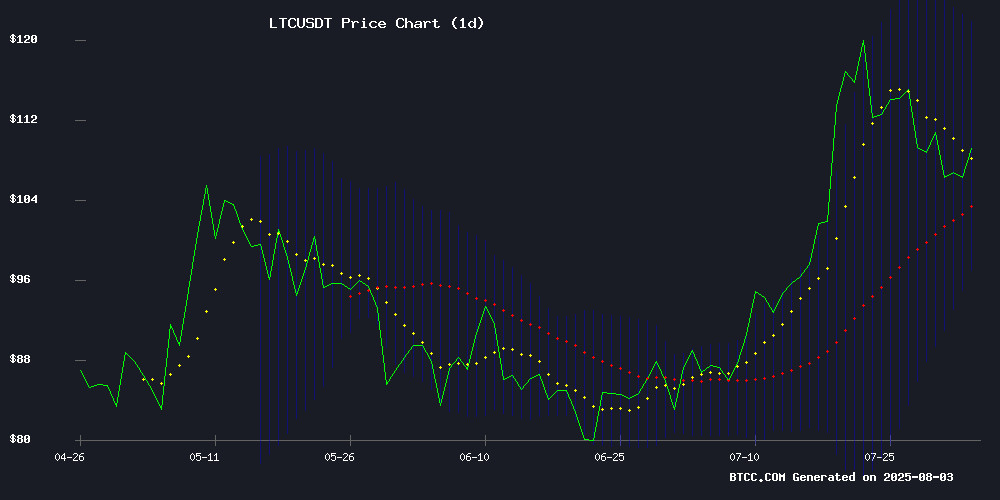
Litecoin (LTC) is currently trading at $109.87, slightly above its 20-day moving average (MA) of $109.27, indicating a potential bullish momentum. The MACD histogram shows a positive crossover at 4.5731, suggesting increasing buying pressure. Bollinger Bands reveal LTC is trading closer to the middle band, with room to test the upper band at $121.56. According to BTCC financial analyst William, 'The technical setup favors a breakout if LTC holds above the 20-day MA, with a near-term target of $121.'
Litecoin Market Sentiment: Halving Momentum Meets ETF Speculation
Litecoin's consolidation near $108 reflects mixed sentiment post-halving, with headlines oscillating between breakout Optimism ('Potential Surge Toward $150') and regulatory uncertainty. BTCC's William notes, 'The AI mining narrative and ETF speculation could amplify volatility, but technicals suggest the $108-$110 zone is critical for directional bias.'
Factors Influencing LTC’s Price
Litecoin Consolidates Near $108 Amid Post-Halving Momentum and ETF Uncertainty
Litecoin (LTC) hovers at $107.84, marking a modest 0.81% gain, as the market digests conflicting signals from its recent halving event and regulatory delays. The halving on July 31 successfully reduced miner rewards, historically a bullish catalyst, pushing prices briefly to $109.28. Yet the SEC's postponement of Grayscale's spot LTC ETF decision until October has tempered momentum.
Technical indicators suggest room for upside, with the RSI at a neutral 55.22. Network activity surged pre-halving, reflecting strong underlying demand. Traders now weigh long-term scarcity dynamics against short-term regulatory headwinds—a tension that could define LTC's trajectory through Q3.
Litecoin (LTC) Price on the Move! Breakout Signals Potential Surge Toward $150—But Here’s When..
Litecoin (LTC) is exhibiting signs of a steady recovery, trading within a tightening range that hints at growing bullish sentiment. The cryptocurrency has reclaimed the $106–$110 zone, with price action turning cautiously optimistic. A potential breakout above $115–$120 looms, raising questions about whether LTC can revisit the $300 range or even push toward $350 by August 2025.
Short-term profit-taking has caused minor dips, but Litecoin remains a top altcoin to watch this month. ETF speculation is fueling bullish momentum, with technical charts suggesting upside targets at $123 and $130 if LTC holds above $110. However, weekly charts indicate weakening bullish strength, as gains from recent weeks threaten to unravel. The falling OBV (On-Balance Volume) further validates the bearish thesis.
DL Mining Launches AI Cloud Platform for XRP and Multi-Crypto Mining
DL Mining has unveiled an AI-powered cloud platform designed to democratize cryptocurrency mining. The service supports XRP, BTC, ETH, and 12 other digital assets, eliminating hardware requirements through its adaptive intelligence engine.
The proprietary system dynamically allocates mining resources across 15 cryptocurrencies, including SOL, LTC, and BCH, while optimizing returns through real-time market analysis. "We're building an intelligent wealth creation engine," said CEO Luna Smith, emphasizing accessibility for non-technical users.
Notably, the platform offers full XRP mining integration—a rarity in cloud mining services—with seamless deposit and withdrawal functionality. The AI engine performs daily portfolio rebalancing, tracking market trends to maximize profitability across supported assets.
Is LTC a good investment?
Litecoin presents a compelling case for investors, combining technical strength with event-driven catalysts. Below are key considerations:
| Metric | Value | Implication |
|---|---|---|
| Price vs. 20-day MA | $109.87 > $109.27 | Bullish momentum |
| MACD Histogram | +4.5731 | Buying pressure increasing |
| Bollinger Band Position | Near middle band | Potential upside to $121.56 |
William cautions, 'While the $150 target is plausible, investors should monitor the $108 support and ETF news flow closely.'
human-polished
